

America’s transit ridership has recovered substantially from the pandemic: Americans took 8.1 billion transit trips in 2025, the fifth consecutive year of growth. But rail systems continue to have vast spare capacity (indeed most American rail systems actually began stagnating or losing riders years before COVID). The country is also short millions of homes in the highest-demand metropolitan areas. Familiar estimates range from short-term estimates of about 4 million, using current household formation and vacancy targets, to longer-term forecasts of more than 20 million homes suppressed by regulatory barriers that prevent migration to the highest-demand locations.1 Many of those same expensive metropolitan areas are where our forebears already built useful rail infrastructure. Yet local governments are still telling would-be transit riders that it is illegal to live next door. This has always been insane2 from both climate and economic growth perspectives, but now it is urgent.3
Robot cars are coming
Waymo last reported a service area now growing to more than 1,400 square miles across 11 cities. We have finally reached the point where “self-driving cars are five years away” is no longer a joke.
To be clear, this is still good on balance. Robot drivers that never drive drunk, respect cyclists, and crash less often than a human driver would be a major public-health improvement. Not having to park is a real urban amenity, especially given the difficult political economy of charging market prices for curb access. Beyond the safety benefits, autonomous vehicles (AVs) could, with sound policy choices like congestion pricing in urban cores and High-Occupancy/Toll (HOT) lanes on highways, complement transit for trips and riders that fixed-route service handles poorly.
But AVs will probably also compete with transit. Ride-hailing offered a premium-priced but convenient door-to-door substitute for discretionary bus trips during the 2010s, while rising incomes and increased household car ownership diverted even more transit ridership in some markets. (Uber became the focal point for the wider phenomenon of urban cars outcompeting urban mass transit during the 2010s, even though it’s surprisingly hard to prove to a peer-reviewable standard that Uber has actually been an important culprit in the transit decline.)
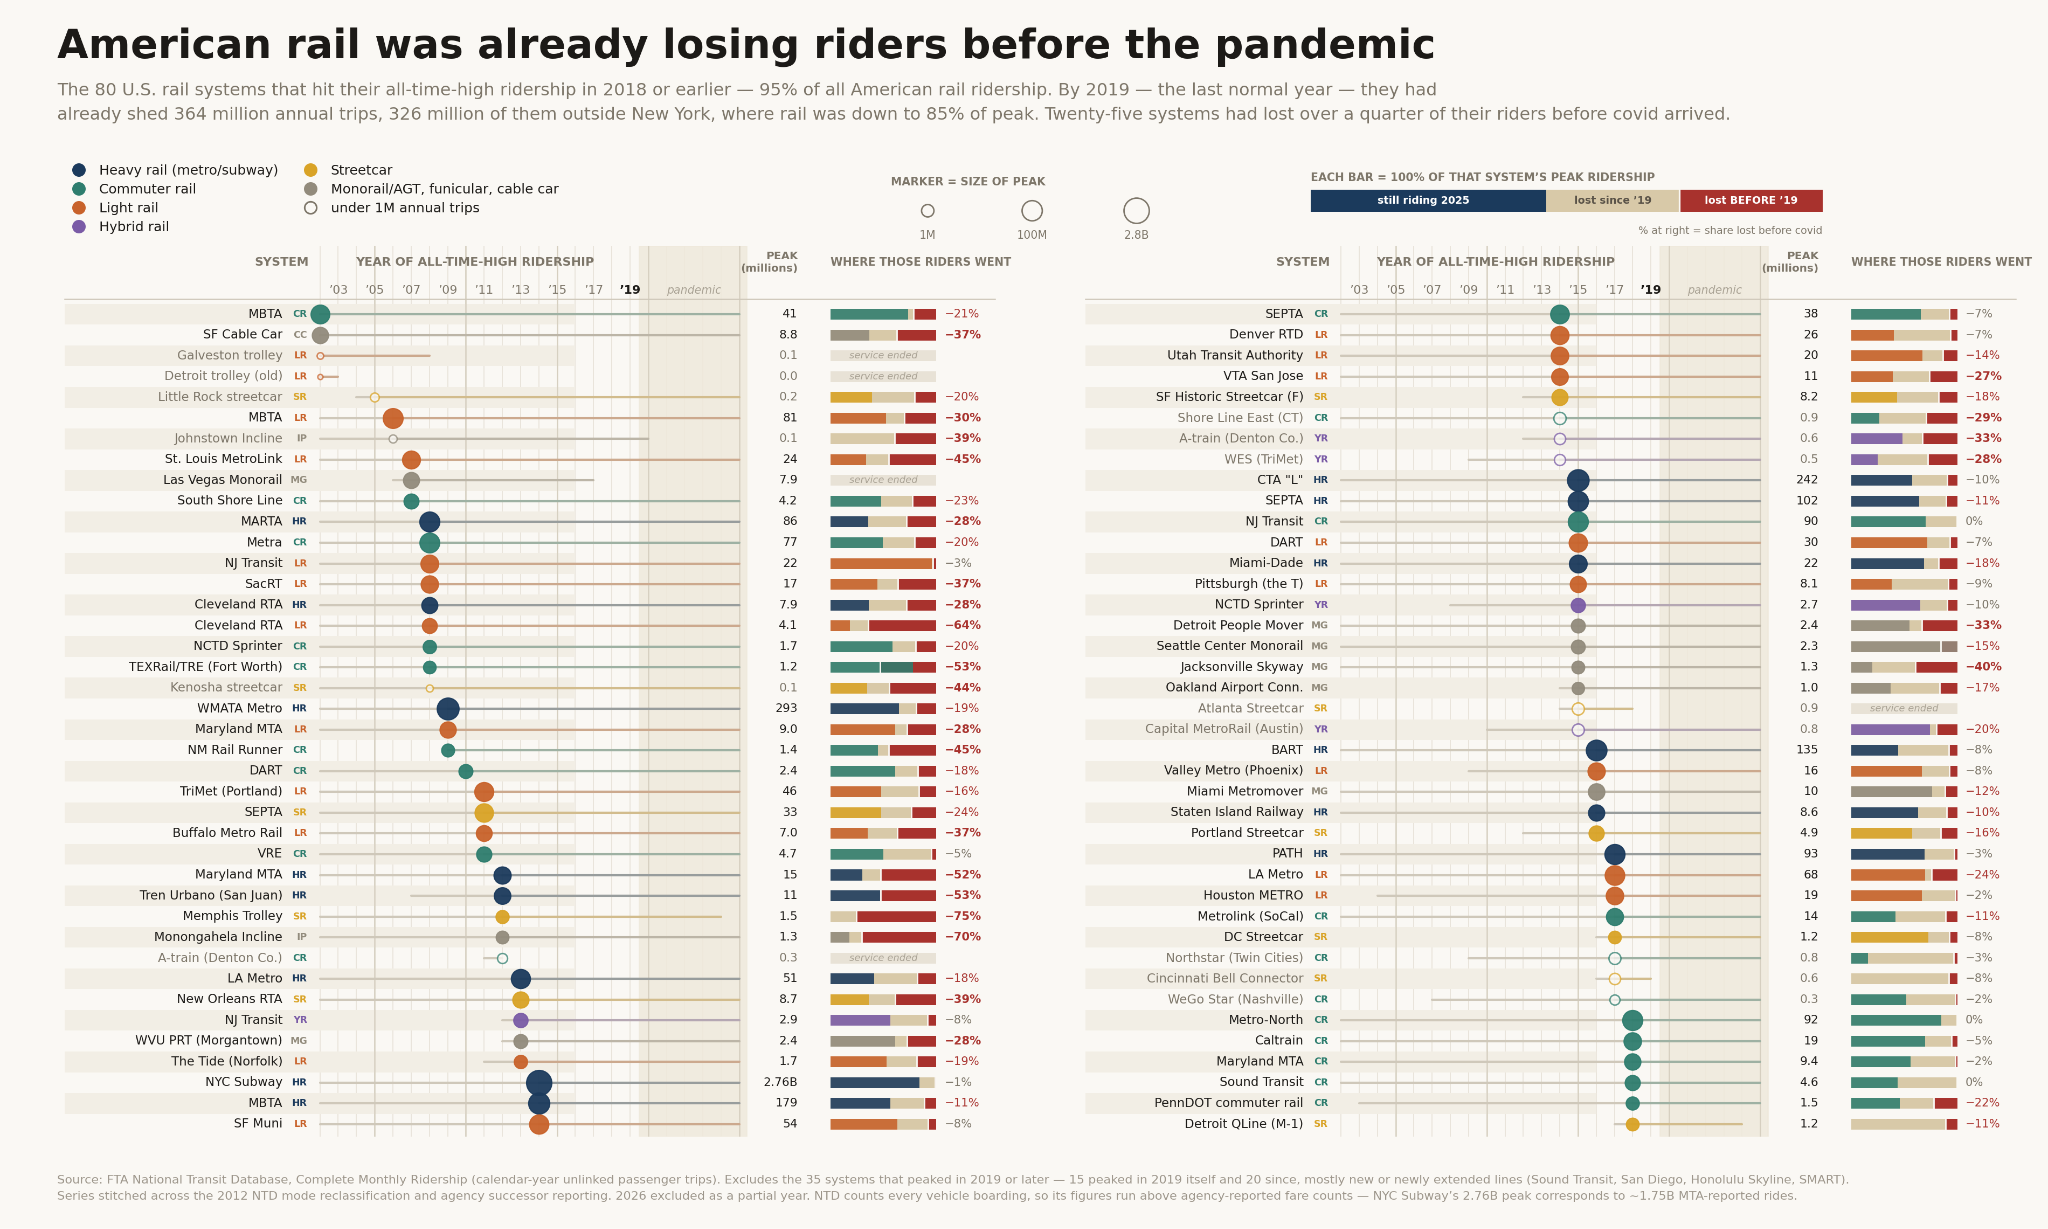
Figure: National Transit Database ridership file rendered by system and mode. 80 out of 115 US rail systems in the NTD file peaked in Unlinked Passenger Trips in 2018 or earlier, long before COVID.
Now, a transit expert might balk that this concern about competition with mass transit concedes too much to both existing ride-hailing firms and to future autonomous vehicles. The first objection is empirical: the stagnation of American mass transit systems in the 2010s is not mostly attributable to ride-hailing alone.4
The second objection is conceptual and longer-term: the densest urban cores cannot realistically be served by single-occupant vehicles. As the well-worn “vehicle geometry” problem frames it, cities just cannot squeeze enough single occupant vehicles on the roads for the volume of people moving through the highest-density urban cores. But in-motion vehicle geometry is not the only problem; there is also a bottleneck in the mechanics of loading and unloading. If you’ve been to a concert or sporting event in San Francisco, you’ll note the vast pool of Waymos trapped in clumsy, low-throughput pickup and dropoff lines while people fumble with the doors and slowly clamber inside. High-throughput mass transit stations with level boarding and multiple wide large-vehicle doors are necessary at the human geometry level to be able to embark and disembark quickly on limited urban core curb frontage.5
But AVs do not need to eliminate rail to create a problem. They only need to skim enough trips to weaken fare revenue and political support, producing service cuts that drive away still more riders — driving yet another wave of higher taxes for worse service. In potential cases where voters balk at higher taxes for worse service, urban rail systems will collapse on a scale unseen since the 1970s, unleashing congestion and serious particulate matter pollution even if the cars are all-electric.6
A physically realistic benchmark goal for national TOD: 40 homes per gross acre
Density alone is not the only predictor of travel behavior: A dense neighborhood with no sidewalks and zero transit service definitionally cannot have any transit ridership.7
Academic caveats aside, residential density is an important and nonlinear predictor of transit ridership. The Transit Capacity and Quality of Service Manual, a policy guidebook published by America’s national academy for transportation science, advises transit and land use planners that the ridership returns to density near transit are steeply increasing with rising density. See the figure below, a copy of Exhibit 3-9 in the Manual:
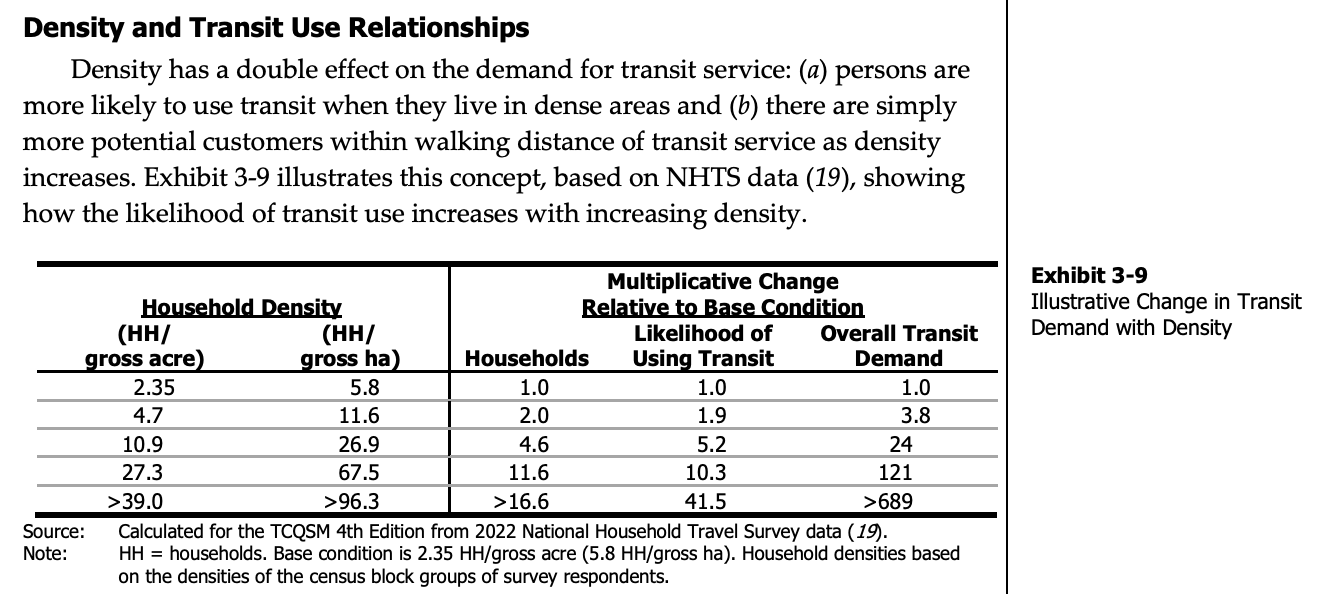
Figure: TCQSM nonlinear relationship between density and transit demand
The national manual for transit service policy and planning is not omniscient, but it does propose a convenient and long-accepted national density threshold at which transit demand inflects to its most transit-friendly level: 40 dwelling units per gross acre. For federal policymaking purposes, a person living in an urban-density neighborhood above 39 units per acre is more than 41.5x more likely to use mass transit than a person living in an exurban, roughly half-acre zoning neighborhood at 2.35 units per acre.8
This 40 units per gross acre density threshold will form the analytical backbone of our TOD scoping and benchmarking exercise. There is no single correct answer about how many transit trips any given new apartment will produce, because service frequency, mode travel time competitiveness, tolling and parking policy, and other variables can also affect mode choices. But a reasonable lower bound estimate of this hypothetically built-out housing exercise still yields enough new transit trips to fully reverse the national post-COVID transit ridership losses (see below).
A deliberately mechanical benchmark
We’ve established that transit-oriented development matters for saving America’s rail systems from a nasty mix of continued operational decline, lower social returns on higher transit subsidies, and some lower-probability tail risks of tax revolts and total transit system collapse. But is the TOD opportunity space big enough to matter for the housing crisis?
If America is “short” somewhere between 4 million homes and 20 million metropolitan homes, the unused growth potential on the land near our rail systems has to be in the millions to be relevant. And it can’t just be any old land near any old train; it has to be where people are voting with their wallets to live: high-wage, high-amenity places where housing prices are above marginal housing supply costs (meaning that growth-control regulations are already the only thing stopping more people from building and living there).
The short answer is yes: physically and financially realistic TOD housing potential is a big deal, and is underrated as a reform opportunity on a surprisingly massive national scale. To be sure, one should treat this particular rail analysis as an order of magnitude rather than an exact count. But America’s bus networks are much vaster than our rail networks, and cover many more cities. Beyond this rail exercise, TOD in reality includes opportunities around buses and all the neighborhoods within walking and biking (or other micromobility) distance of downtowns. Without including those opportunities, this rail-only figure still yields strong-market capacity to build homes on a scale that is large relative to America’s short-term housing needs.
Finally, I want to push back on any hyper-literal or “overly engineering-brained” interpretations of these rule-of-thumb forecasts and planning heuristics for complex social and urban economic systems with endogenous or even self-regulating feedback loops that often do not behave like linear engineering problems. The elevation of rigidly simple traffic engineering and growth control planning rules of thumb, prioritized over social science and observable preferences revealed in market prices and behavior, created the very transportation and housing bottlenecks this analysis hopes to help solve. The point of this exercise is just to show that the mix of physically realistic growth opportunities currently banned by land use regulations, combined with revealed consumer preferences for transit-adjacent living observable in existing rents and home prices, together yield a reasonable expectation that relaxing the worst forms of central planning near our transit systems would plausibly yield voluntary actions on a large enough scale that is likely to solve our country’s most pressing housing undersupply and transit ridership sustainability problems.
Desirability and first-cut feasibility: Filtering physically realistic capacity from 31 million to financially plausible capacity for 13.5 million homes
America’s Census block-level capacity for allowing up to 40 homes per gross Census acre within a half mile of America’s rail systems is 31.3 million additional homes.9 This exercise thus answers one narrow question: How many more homes would these station areas contain at a half-mile-area average of 40 homes per Census land acre? First, some caveats:
This is an illustrative gross-density gap representing the physical realism of development potential (it is not zoned capacity or a production forecast).
A straight-line half mile is not always a half-mile walk.
Some land should not or cannot be residentially developed.
The calculation assigns the same benchmark to tidy residential blocks and to blocks dominated by office buildings or other nonresidential uses.
However: I excluded all Census blocks that now contain zero housing units or population, eliminating almost a quarter of the housing potential from this forecast to substantially account for airports, parks, and heavy industrial areas (see methodology appendix).
Even with those caveats, 31 million usefully establishes the physically realistic scale. It is larger than any conventional estimate of the national housing shortage. And remember, it’s still just a rail-only exercise: America’s bus networks cover much more land area than our urban rail networks, and high quality car-competitive bus networks can be scaled up in less than a decade.
The next question is where additional market-rate construction is at least plausible, financially. In much of America, especially outside high-wage metro areas, existing homes sell for less than it costs to replace them with new apartments. Upzoning those places is harmless, and could facilitate sparks of subsidized community development, but it will not unlock much construction in the current market.
I divided the station-area blocks into broad market tiers tied to my own rough estimates of inflection points in housing construction costs and first-cut market feasibility. These are binned using American Community Survey (ACS) median home values, with ACS contract rent as a fallback for blocks that didn’t have home value data.10 The “cool” category ($150k to $300k) approximates the roughly $250,000 “minimum profitable production cost” per single family home in Glaeser and Gyourko (2018).11 For the next bin, the “hard” construction cost to stack an extra 1,000 square foot home onto a Type I high-rise tower in NYC, America’s highest-hard-cost construction market, averages roughly $534,000, and San Francisco is the only other US city over $500,000, making $500,000 a relevant rough-cut threshold for the leading edge of high-rise multifamily construction feasibility. $800,000 is the threshold where even a $500,000 marginal hard cost of multifamily construction, with a soft cost multiplier around 30%, could together yield a ~20% gross margin to the builder on those hard and soft total marginal development costs.12 In other words, $800,000 per home is a plausible threshold for where incremental units added to (even high-rise Type I) skyscrapers in very difficult construction environments, at heights triggering all of the most hostile building code mandates beyond 7 stories, should be widely feasible if allowed cleanly by-right.
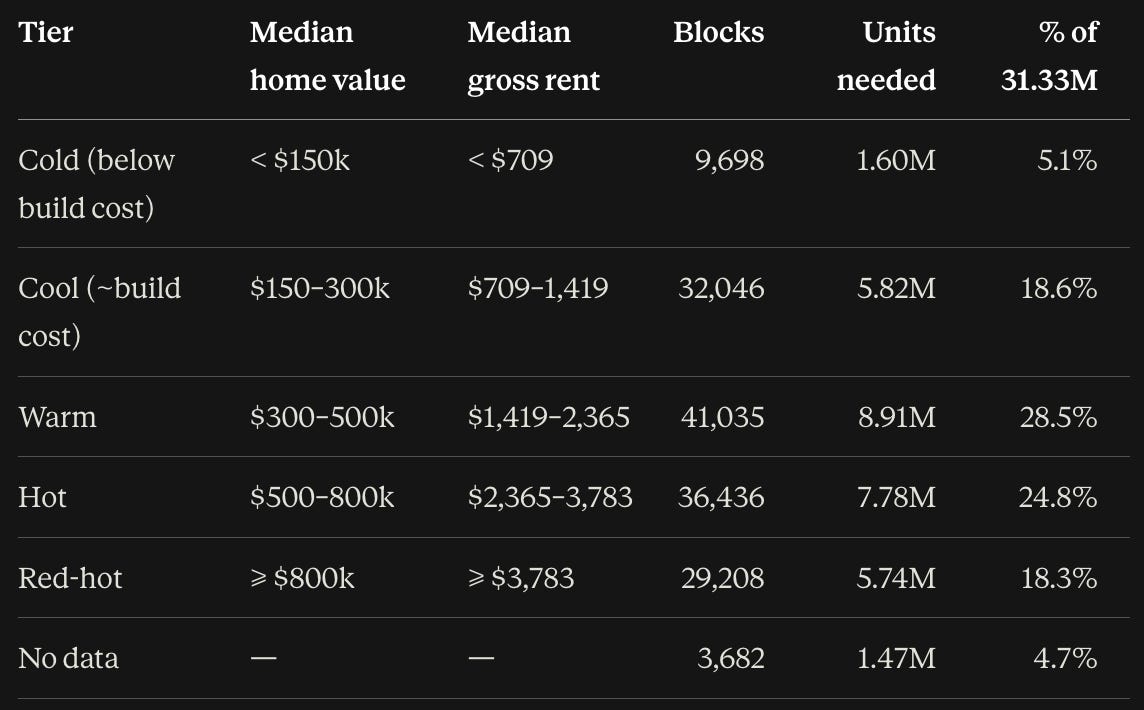
I label two tiers as high-demand:
Hot: median home values from $500,000 to $800,000, or monthly rents from $2,360 to $3,780. These blocks account for 7.8 million homes in the gross-density gap.
Red-hot: median values above $800,000, or rents above $3,780. These blocks account for another 5.7 million.
Together, the hot and red-hot blocks account for physically realistic capacity for 13.5 million additional homes under the 40-per-gross-acre benchmark in the highest-demand station areas where home prices are very likely to be above minimum profitable construction costs. This price screen still does not directly convert theoretical headroom into truly “market-feasible capacity.” I have complained at some length about planners making related mistakes. A serious soft-site analysis also needs parcel characteristics, the value and condition of existing structures, land assembly, local construction costs, financing, taxes, fees, and the actual density increment allowed by zoning. My screen tells us where demand conditions indicate zoning is most likely to bind. It does not identify the specific buildings likely to be demolished next year.
To be sure, one would also need to zone much more liberally than a 40 units-per-acre cap to achieve a realized production outcome averaging 40 units per acre within the next few business cycles. SB79’s zoning for 120 units per acre on high-quality rail sites (allowing seven-story buildings) is a good way to think about what should be allowed near rail, even in places where only the cheapest IRC rowhouses or three-story IBC Type V-B walkup apartments will pencil in weaker land markets.
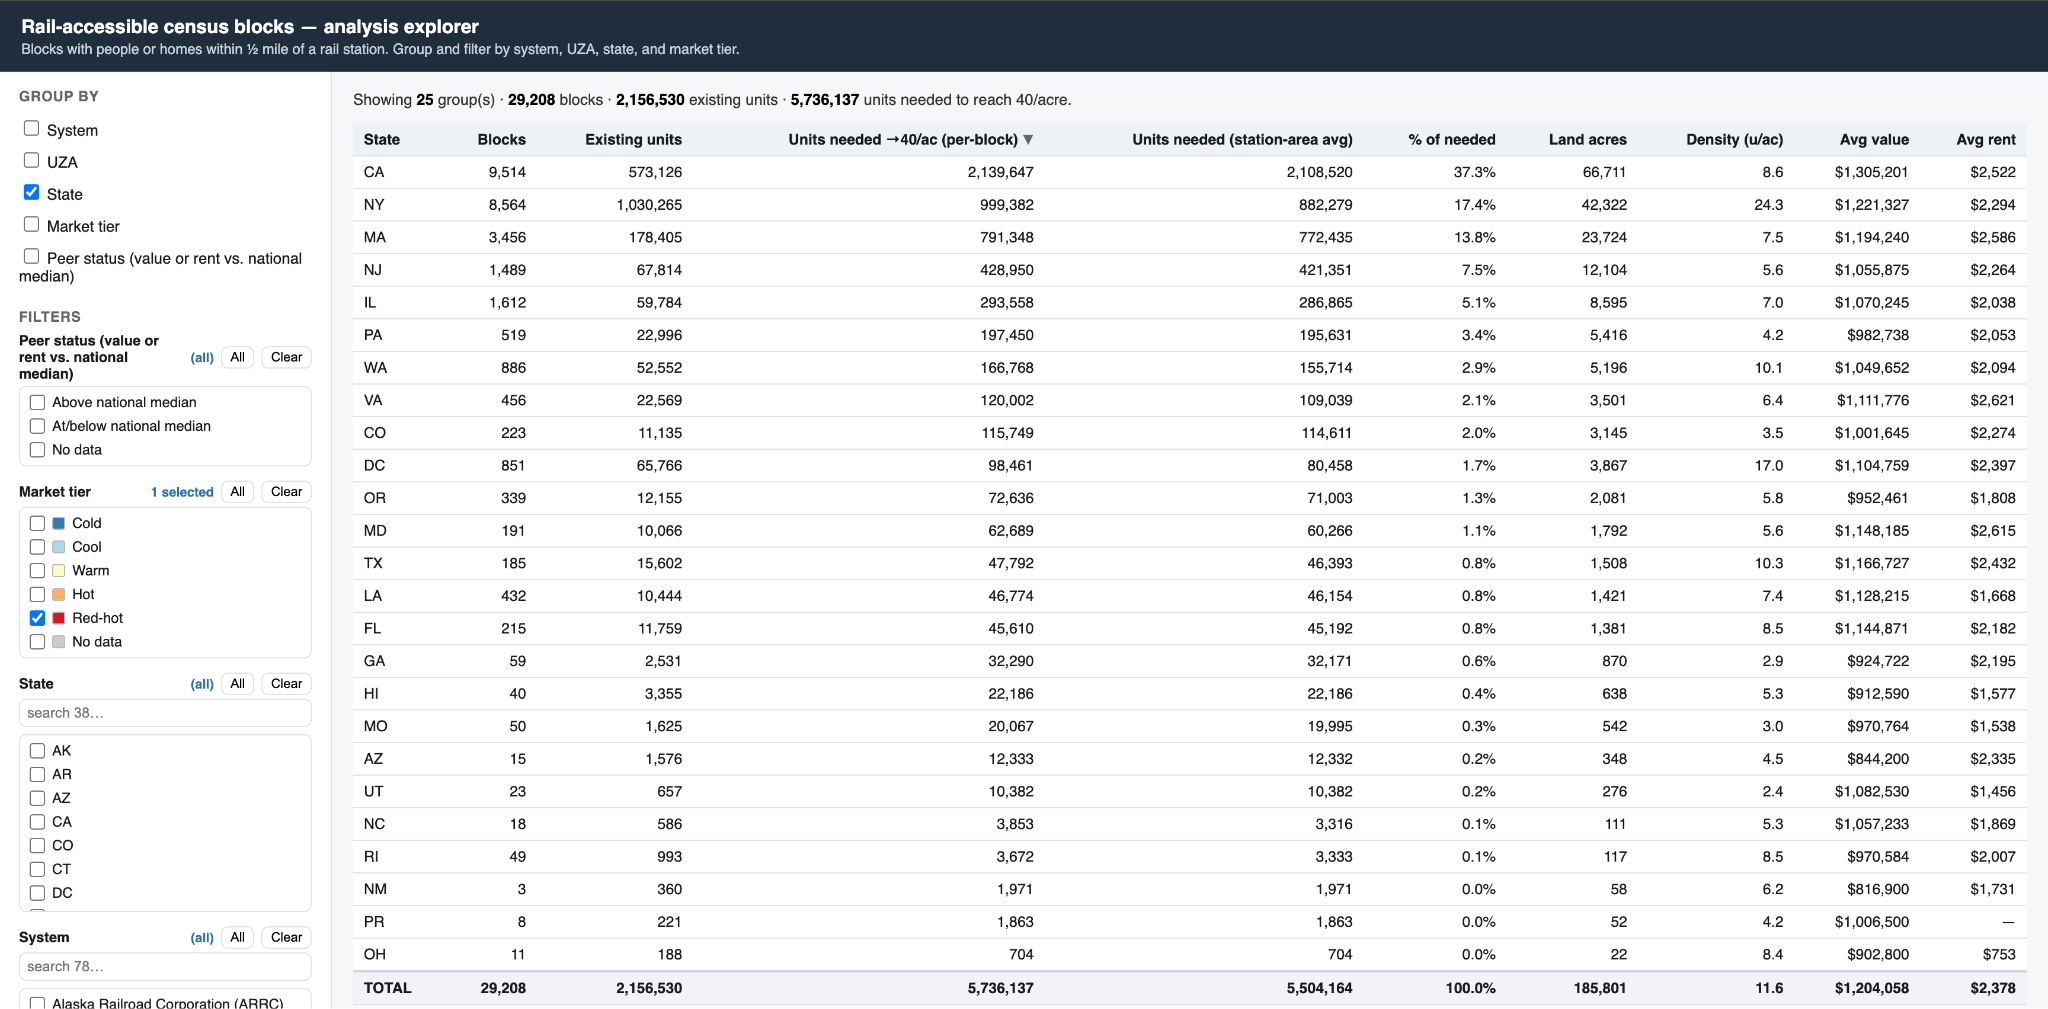
Figure: State-by-state counts of current housing units and physically feasible capacity. Try other cuts of the data for yourself, and view every covered Census block on this live map.
What 40 units per gross acre actually looks like
“Forty units per acre” may sound more visually dramatic than it often is because density gets discussed through the most noticeable building rather than the land average around it. New York City offers a useful example. Among New York’s Census blocks near rail, I find the median block has about 29 homes per acre, and 62% of the blocks fall below 40. Yet the median home near rail sits on a block with about 63 homes per acre.
Most blocks are relatively low-density, but most people live in the smaller number of blocks containing apartment buildings.13 In many blocks, reaching the benchmark could mean one small or medium apartment building: a 24-home single-stair walkup, perhaps, or a 100-home mid-rise on a larger parcel.
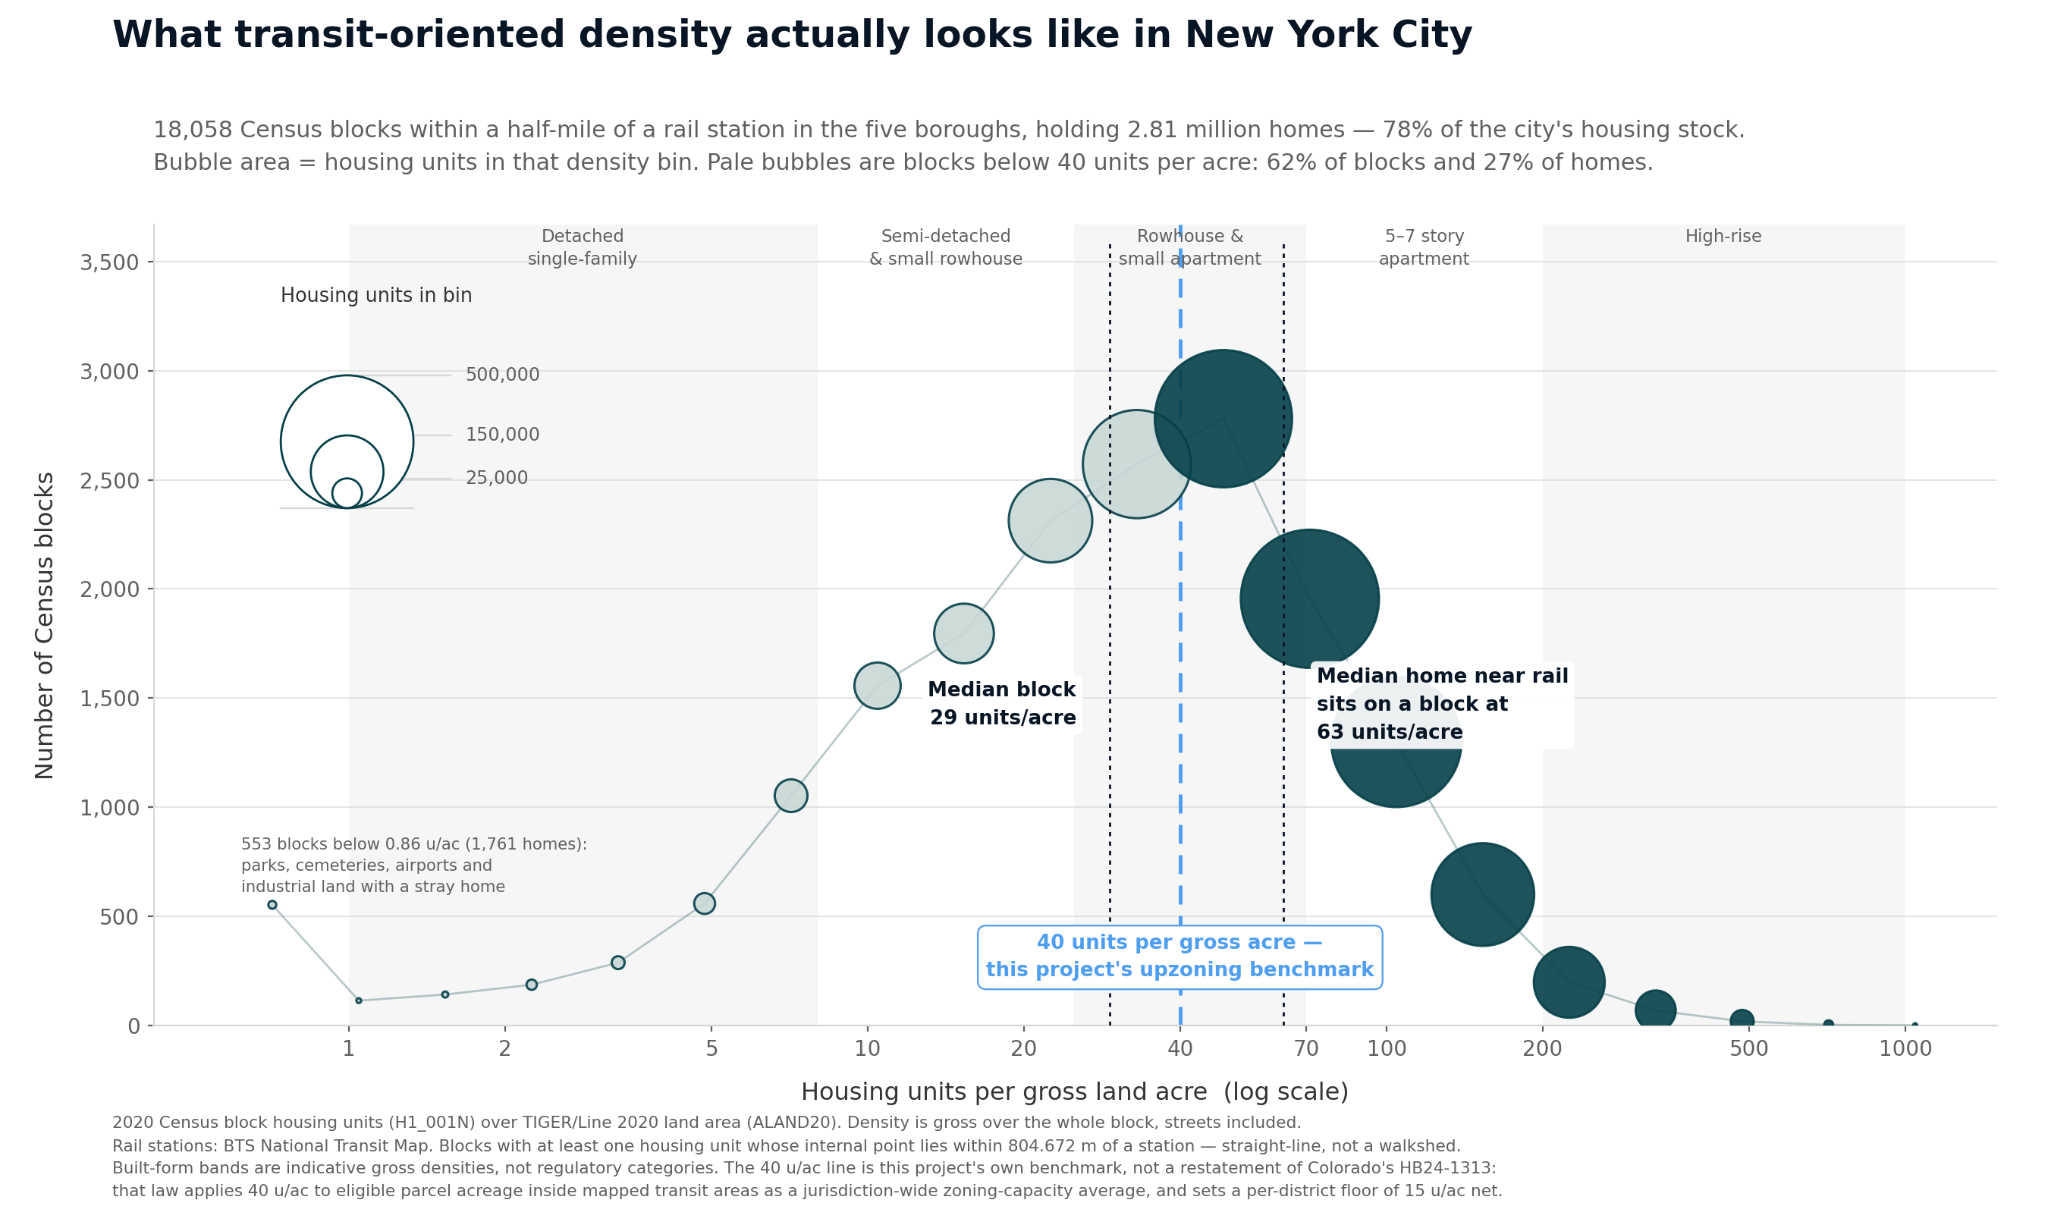
Figure: Forty gross units per acre doesn’t entail Manhattanization on average, just rowhouses and the occasional apartment building. Even in New York City, 92% of residential structures are still three stories or fewer.
The largest gross-density gaps appear in the New York, Chicago, Philadelphia, Boston, Los Angeles, and Washington metropolitan areas. Commuter rail looms especially large: The station areas of Metra, SEPTA, NJ Transit, and the MBTA each contain more than two million homes of “gap” at the 40-per-gross-acre benchmark. Much of the opportunity is not in downtown skyscraper districts. It is along mature rail corridors where the public sector owns the expensive infrastructure and local zoning still treats an ordinary apartment building as an exotic industrial use.
A benchmark ridership scenario:
Having warned above about the dangers of taking mechanical “traffic engineering-brained” forecasts too seriously as a tool to justify coercively mandating or banning innocuous choices in housing and transportation policy, let’s indulge in one last mechanical forecast to estimate a lower bound of how many riders our 40 units per acre gross building envelope would yield.14
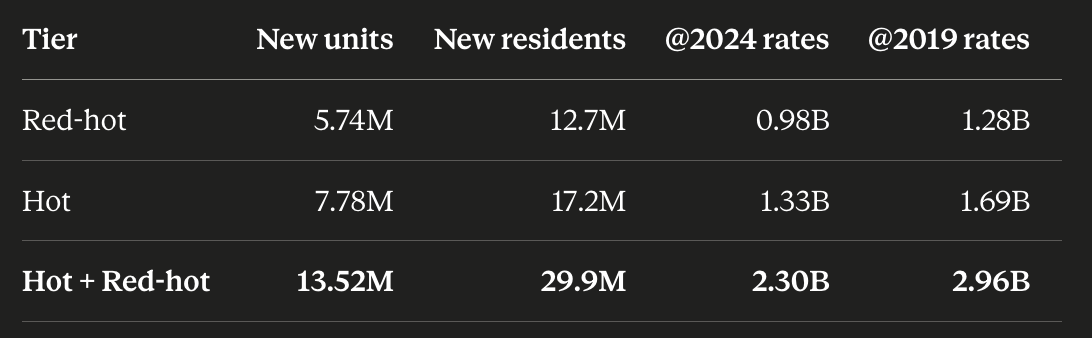
Figure: Calculated annual unlinked passenger trips from our land use exercise if new units are occupied at 2.2 people per home, with those people taking mass transit only as frequently as the average regional resident in earch rail system’s home region. 2024 has fewer trips per capita than 2019; calculations from both years are shown.
At 2024 transit ridership rates per person in each of the urbanized areas with rail systems, the nearly 6 million red-hot homes in our exercise would yield 1 billion new unlinked trips per year, increasing nationwide transit ridership by about 13 percent over current levels. Adding the nearly 8 million “hot” homes bumps that up to 30 percent. (There were roughly 9.9 billion unlinked transit trips on all modes in the US in 2019, and about 7.8 billion unlinked trips in 2024.)
The upshot: Physically and financially plausible rail-only TOD would be sufficient to completely reverse the national-level decline in transit ridership after COVID. If we expanded this analysis to high-demand blocks around frequent bus routes and neighborhoods walkable to job centers, the results would transcend mere pandemic recovery, and venture into outright reversal of America’s long-term declining relationship with mass transit. The benefits to economic growth, congestion, climate, land conservation, and the amenity and livability benefits of allowing most of America’s next 30 million homes to be built in the most extremely desirable neighborhoods in the country near mass transit (if people in the aggregate choose to do so voluntarily, without eminent domain) are immense.
Legalize a rider base
Will allowing homes near transit in high-demand places actually work? The closest thing American housing policy has to a natural experiment is Long Island City. LIC was rezoned to allow housing in 2001, with development taking off sharply after 2010 as LIC went from roughly 35,000 to 63,000 residents — 78% neighborhood-level growth in a decade, most of it in market-rate apartments a subway ride from Midtown. That is what clean transit-oriented upzoning does when the zoning constraint is actually released. Large reform case studies like NoMA in Washington, DC; Hudson Yards in Manhattan; Downtown Brooklyn; Gowanus, Brooklyn; and Austin’s University Neighborhood Overlay are all-star examples of rapid financially feasible growth commencing immediately after “clean” by-right upzoning.15 Multiply that fast-acting neighborhood level land use reform pattern across the hottest neighborhoods on America’s rail systems and we get 6 million potential red-hot homes.
Again, this is just a draft analysis looking at the development potential of rail systems only. Widening the analytical scope to alternative-transportation development opportunities beyond rail would include cheaply scalable bus rapid transit corridors, high-frequency local bus corridors, and any land areas within walking distance of downtowns but not yet served by a frequent fixed-route transit line. Someone should do that wider analysis but this rail-focused minimum viable product shows rail alone is big enough to matter. The rail analysis also conveniently centers the most above-cost large metro areas and the overpriced, undersupplied neighborhoods targeted by the Abundance and Growth fund (AGF)’s urban economics methodology.
This is not to say that the only place new housing should be legal is next to America’s trains: AGF supports broad upzoning to allow freedom of location choice. The goal of this analysis is only to demonstrate that TOD is not a marginal or boutique idea and should be a much bigger part of the near-term housing reform conversation.
Climate funders in particular should take note: Even if housing abundance is not an organization’s main goal, anyone who cares about climate has an opportunity to work with AGF grantees and the whole YIMBY ecosystem to prioritize land use reform wins on the scale of California’s SB79. That means cheaply decarbonizing transportation for millions of new homes simply by rescuing existing transit systems while reducing per-capita energy consumption all while increasing economic growth. American voters and volunteers are already solving the housing crisis with all-of-the-above solutions; climate funders now have the opportunity to make sure TOD is at the top of the housing reform conversation in every state with a big rail system.
America’s large rail systems are probably not at mortal risk from autonomous vehicles: The prewar urban core corridors of the biggest transit systems move too many simultaneous people for low-throughput, car-based vehicle geometries to fully shut down their transit systems. (Multiple parallel autonomous Bus Rapid Transit lines could combine enough corridor throughput to be able to replace most rail US systems, but autonomous cars alone cannot). Voters are more likely to vote for higher subsidies to keep the systems running even at lower utilization levels, unless we take this opportunity to solve both our housing and our transit problems. We already built the trains! Just let the riders live near them.16
Methods appendix
To start, I overlaid 2020 Census blocks with the Bureau of Transportation Statistics’ National Transit Map. After consolidating duplicate platforms and station entrances, the data contain 5,672 rail stations and 152,105 populated or developed Census blocks whose centroids lie within a straight-line half mile of one. Those blocks already contain about 9.2 million homes.
Then I asked how many additional homes these blocks would contain if each reached 40 homes per full Census land acre. I chose 40 homes per gross acre because it is the floor of the top transit-supportive density tier in the TCQSM’s density-demand relationship, which is measured — conveniently for a Census-block analysis — in households per gross acre.17 I also excluded Census blocks that currently have zero households or residents in the Census data, reflecting the fact that many transit-adjacent Census blocks are airports, parks, heavy industry, or other places where residential redevelopment may be unlikely.18 Those excluded Census blocks are 2,041 water-only blocks covering 34,309 acres, and 46,026 completely vacant blocks with 267,406 acres of land. This is 24 percent of all Census blocks and 22% of all land near rail stations, enough to hold 10.7 million homes at 40 units per gross acre. This creates some risk of an underestimate: Converting unoccupied industrial land to residential land is the source of some of the nation’s most successful recent upzonings like Gowanus in NYC and NoMA in DC. But on the other hand, some of the land I did count includes commercial central business districts with small but nonzero resident populations, like Midtown Manhattan, where it’s not obviously likely that office conversions and new infill will reasonably be able to achieve 40 gross units per acre amid massive office towers in a land market where office usually remains the highest and best-yielding use. On balance, excluding 22% of all station-adjacent blocks for vacancy reasons gives me high confidence that this exercise is at least not an underestimate.
Finally, the gross versus net land area distinction is an important difference in what a “units per acre” number means. Forty homes on an acre of buildable residential land is approximately one attached home per 1,100 square feet. Forty homes per whole-block gross acre must fit the homes and the streets and other nonresidential uses on the same acre. Unless the street has become one of the homes, the latter requires smaller lots, apartment buildings, or a mix of the two. So 40 at the Census-block scale is more demanding than either 40 on residential parcels or Colorado’s 40-times-non-exempt-acre capacity goal.
Full replication files are available on request (and if there’s wider interest, we will edit this post and host them openly for public use, localization vetting, and extensions to further analysis suggested herein).
There is no literally-true definition of a nationwide housing “shortage”, but there are useful proxies and models that outline the nature and scale of different ways to think about housing underproduction in the parts of the country where there is a regulatory shortage over varying time horizons. Up for Growth's recent underproduction estimate is ~3.78 million homes. This accounting-based method is not an academic “urban spatial model”; instead, the method asks how many homes would be needed under current patterns of household location to relieve overcrowding and restore a healthy vacancy rate, assuming zero mobility between metro areas after reform. Urban spatial model estimates based on the homes suppressed by land-use regulation that account for wage and amenity differences, forecasting mobility between places on a long time horizon, ask a much larger counterfactual question and can exceed 20 million.
Insane in the sense that it is contradictory to even the most basic legal basis for land use regulation–to further the “health, safety, and welfare” of urban residents–to ban housing next to transit.
This essay will not claim that every physically possible home near transit should be mandated or strictly compelled by government action, like eminent domain and public funding or direct public construction, to exist next to every rail station. This essay will simply demonstrate that it should no longer be illegal to build and live next to a train when renters, buyers, & builders collectively reveal a voluntary preference to do so.
Since the invention of comprehensive zoning in 1916, land use planners have overly concerned themselves with microregulating density near transit, in many cases banning apartments altogether. But free people making voluntary location, transportation, & construction choices are good at picking what’s best for them as individual renters, buyers, and builders. The 20th Century loss of faith in voluntary land markets to allocate densities and uses, and the turn to rigid central planning to allocate virtually all land use and transportation options, has ironically mandated car ownership and produced endless highway-oriented sprawl and congestion. The introduction of ostensibly comprehensive urban planning has produced modern cities that are arguably worse-planned than 19th century cities built before zoning. If we relax the iron-fisted grip of infill growth controls in cities, it still doesn’t mean infinite housing will be built. The only housing that will “pencil” financially, if allowed, is housing where renters and buyers judge that, all things considered, those locations and densities yield better places to live (with higher consumer willingness to pay to builders) than their next best options.
Even the pessimistic reputable studies find only a 10% decline in bus ridership and ambiguous effects on rail (some positive, some negative). The peer-reviewed transportation literature finds mixed effects of ride-hailing company entry on transit ridership: Across 56 different studies of ride-hailing, the consequences are heterogeneous and surprisingly hard to distinguish from zero. Blaming Uber for the entire transit decline in the 2010s has become a stylized fact among American urbanists and commentators, but the peer-reviewed literature is nowhere near as certain.
So even if superintelligent cars can coordinate and “platoon” to double the rate at which in-motion cars can clear an average intersection, that gain only applies to people already seated. The embarkation geometry of thousands of humans getting into and out of vehicles stopped at existing curbs cannot be easily changed. Mass transit in some form will still be with us wherever densities are high. Speculatively, future urban developments could adapt at least some off-curb loading capacity. Airports like SFO have already had to turn a whole garage floor with 1,000 parking spots into a ride-hail staging area just to handle trip volumes equivalent to a single high-frequency bus line (800,000 trips per month). But the point is, the normal downtown surface-street curbs of America’s densest urban cores simply cannot handle even the most intelligent autonomous cars with small doors and car-like dwell time loading performance.
Voters have thus far mostly supported ballot measures or other tax and funding increases to rescue large transit agency budgets. Following a temporary state loan to San Francisco area transit, Bay Area voters will decide this year whether or not to destroy Muni, BART, and Caltrain.
Physical proximity to transit, destination accessibility, and street design matter more than density alone, but in trivially obvious ways: A dense neighborhood with no sidewalks and zero transit service is not going to have any ridership. In the short run, the strongest single-variable lever is usually the service itself: a 14-year study of 25 North American systems found service quantity and car ownership to be the key short-term determinants of ridership, but again those variables evolve endogenously with land use. That pattern makes sense because service quantity and housing density are complements. If the origins and destinations for 95% of trips within a metro area lie outside walking distance of the frequent transit network, one should not be shocked to find a transit mode share of 5% or less.
This nonlinearity in the ridership returns to density is why “lukewarm” rezonings, like SF Mayor Lurie’s so-called “Family Zoning Plan”, that fall short of full regulatory liberalization near transit tend to produce disproportionately disappointing ridership results.
Allowing station-area averaging, where above-40 blocks to offset below-40 blocks within station areas, reduces it to 30.5 million. Call it 31 million.
The market tiers use ACS five-year block-group median home value, with median gross rent as a fallback; 97.6% of rail-adjacent blocks receive a tier. The rent thresholds use an empirical value-to-annual-rent ratio of about 17.6, based on the buy/rent spread means in the ACS data here. A single national construction-cost reference necessarily screens too generously in some high-cost coastal markets and too harshly in some lower-cost markets. One could contest this rent screen as a mere statistical shadow of the home price screen and argue for a different calibration microfounded in pro-forma rents, but the analysis should still not be highly sensitive to a reasonable range of price-rent correspondences for tiering.
On page 10, the authors estimate Minimum Profitable Production Costs for a single family home on reasonably affordable land ranging from $200k to $260k in 2015 dollars.
I note only soft and hard costs, not land costs, because land costs are inframarginal for incremental multifamily construction: They affect the fixed cost of development at the point of sale for land acquisition, but they don’t alter the profitability of adding marginal units to a joint venture where the landowner contributes land as equity-in-kind to the capital stack, nor do land costs affect the decision about whether or not to add an extra unit to a building under construction. A multifamily builder newly unconstrained by zoning reform doesn’t have to buy more land to add more units: the land is the roof of the unit below.
The typical block, and the block experienced by the typical resident, are not the same statistic, because more people live in the higher-density blocks. A station area can average 40 homes per gross acre without putting a high-rise on every lot. But, to repeat the denominator point, 40 gross is also not simply a neighborhood of 1,100sqft rowhouse lots. Streets, parks, stores, schools, and other nonresidential uses consume land. A 100% single family rowhouse block on 1100sqft lots could in theory hit 40 units per acre, but on average across the country there will be Census blocks with nonresidential uses. Thus apartment buildings would be needed in a frequency and size proportional to the prevalence of nonresidential land area in order to hit 40 units per acre on a particular Census block.
The Federal Transit Administration’s National Transit Database publishes wide-ranging data, including the number of “unlinked passenger trips” by transit mode and agency nationwide. By dividing the annual number of trips per person across the entire urbanized area, and multiplying by the current average occupancy per home in our transit-adjacent Census blocks, we can estimate how many annual transit trips an average regional resident would add to the region for these net new homes. This yields a lower bound estimate because the Urbanized Area average trips per capita calculation combines households who live on top of train stations with people who live in suburbs far from any frequent mass transit. The new homes modeled on top of and close to train stations in our half-mile transit walkshed exercise should be both self-selected to like mass transit and more likely to use mass transit (regardless of personal preference) than an average area-wide resident by sheer proximity.
An unfunded inclusionary zoning overlay, a system of high-cost exactions and special construction taxes, and onerous discretionary review and permitting procedures must not be allowed to convert a nominal upzoning into infeasible development capacity. The policy target is thick and feasible by-right capacity on actual soft sites, paired with transit good enough that nearby residents want to ride it.
I made the New York version of this argument in 2022, but for the hybrid work shock instead of autonomous vehicles. Hybrid work had increased the subway’s effective available capacity by at least 20% for free.
Colorado's 2024 transit-oriented communities law converges on the same headline number, which is interesting, but this analysis is not “the Colorado law applied nationally”. HB24-1313 covers mapped station areas within one half mile of qualifying commuter rail, light rail, and bus rapid transit stations, plus frequent-bus corridors within one quarter mile. The housing opportunity goal is 40 times the acreage of those transit areas after subtracting statutory exempt parcels, which include public and railroad rights-of-way and several categories of unavailable or unsuitable land. Local governments meet the goal with total zoning capacity in qualifying transit centers rather than applying 40 units to every block. Transit-center zoning districts must uniformly allow at least 15 units per effective net residential acre after dimensional controls, parking, and other restrictions are taken into account. The law also permits stormwater-drainage and utility-easement areas to be left out of net-density calculations. In short: 40 is the multiplier for Colorado’s adjusted transit-area capacity goal; 15 is the parcel/zoning-district floor. Despite the apparent resemblance, neither is the same measure used in my Census-block exercise.
A separate sensitivity analysis allows blocks above 40 to offset blocks below 40 within station areas, just as a side check to make sure it doesn’t drive the results. The numerator is 2020 Census housing units. The denominator is ALAND20, the full land area of each Census block polygon; separately tabulated Census water is not included, but no parcel-level deduction is made for streets, parks, institutions, utilities, environmental constraints, or nonresidential land. The 31.3 million figure sums the positive shortfall from 40 homes per land acre separately for each eligible block. The 30.5 million sensitivity nets above-40 and below-40 blocks within station areas. These are observed-housing density benchmarks, not modeled as-of-right zoning capacity. The American Community Survey market variables used later are measured at block-group level, but the housing and land calculation itself uses blocks.
Really well done! Many thanks for this. Perhaps the most overlooked and almost certainly the greatest health benefit of TOD and mode shifting to transit is from increased physical activity. It’s far greater than air quality improvements from vehicle electrification. See e.g. https://link.springer.com/article/10.1007/s11524-020-00510-1#Sec10 The fact that transit trips are almost always “active” - walking or cycling with a shared motorized segment in the middle is often buried in methods of health studies. But loads of evidence shows that transit riders get similar amounts of physical activity as those who report walking or cycling to work. The latter almost always live close enough to commute that way. The vast majority of people in any sizable metro do not and never will. The Dutch are the world champs of exploiting the transit-active mobility link, with massive bike parks at transit stations. Last I checked, I think something like 1/3 of bike trips in the Netherlands are to or from transit. Also, TOD can further increase local walks replacing drives by increasing the number of people and destinations like schools and shops within a walkable area.
This is convincing and impressive, rigorous work. Now I'm going to say the sort of thing I always say (sorry): do we only need to convince a small number of zoning officials of this? Or does a political case need to be made?