
US science agencies have money; can they spend it?
Why and how to keep track of federal spending on R&D

The National Science Foundation is currently making new research awards roughly 70% slower than its historical pace. The NIH is about 50% behind. Even DOE’s Office of Science has been unusually slow to get grants out the door. All of these agencies received strong appropriations from Congress for fiscal year (FY) 2026. So where’s the money?
The past year and a half has been turbulent for US science. In FY25, the administration proposed cutting NIH by roughly 40% and NSF by more than half, froze and terminated grants at multiple agencies, cut staff across agencies, and pursued a range of policy changes that created uncertainty across the research community.1
In August 2025, against that backdrop, we commissioned professional forecasters to predict the next three years of US science funding. They were asked two questions. The first was about appropriations: how much money would Congress give NIH and NSF? Despite the turmoil, the forecasters predicted relative stability, with both agencies expected to land near their FY25 levels.
They were right. In early 2026, Congress passed bipartisan spending bills for FY26 that broadly rejected the proposed cuts. NIH received $48.7 billion, a $415 million increase over FY25, and NSF received $8.8 billion, a slight decrease from FY25 but more than double the administration’s request.
The forecasters were also asked a second question: how much money would these agencies actually spend? Here, they again predicted relative stability. But on this question, the jury is still out.
How federal money moves (or doesn’t)
For our purposes, the federal budgeting process has three key steps. First, Congress authorizes the use of federal resources for certain activities, then it appropriates specific dollar amounts to agencies, then the agencies obligate those funds for their appropriated purpose.
These numbers do not always align. It is not uncommon, for example, for Congress to authorize funding that it never actually appropriates.2 But the deviation that is rarer, and more relevant today, is a gap between appropriation and obligation. In a typical year, this gap is modest and uninteresting; agencies usually spend what they are given at a roughly predictable pace over the course of the year, and communicate to Congress the reasons for any differences between appropriations and obligations.
But the past two years have not been typical. Across the federal government, agencies have been slowing grant-making, terminating awards, and losing the staff capacity needed to process and manage spending.
In FY25, NIH spending slowed dramatically starting in February and into the spring, finally picking up in July thanks to pressure from advocates and members of Congress who pushed back against an attempt by the administration to freeze funding. NIH’s situation was particularly visible, with analysts and media outlets keeping a close eye on its spending rate. But other agencies were not so lucky. It wasn’t until the end of the fiscal year that it became clear that USDA had been struggling to make grants, and ARPA-E ended the fiscal year having obligated less than half of what it was appropriated.3
Tracking science spending
Despite strong appropriations, we’re now several months into FY26 and the same dynamics are playing out again. To ensure agencies are in a position to execute on their mission, policymakers will need to keep a close eye on spending; but information on grantmaking and obligations is fractured across budget execution reports, USAspending, and agency-specific databases.
To support this effort, I built ScienceSpending.org. This site pulls together up-to-date data on spending at five major agencies’ science functions to show whether spending is on pace relative to appropriations and historical trends.4
The site compares each agency’s current spending to spending rates in past years, and provides rates of new grantmaking, all award-making (i.e. including non-competitive continuations or modifications of previous years’ grants), and obligations (the broadest category of spending, including not only award-making, but personnel, admin, etc).
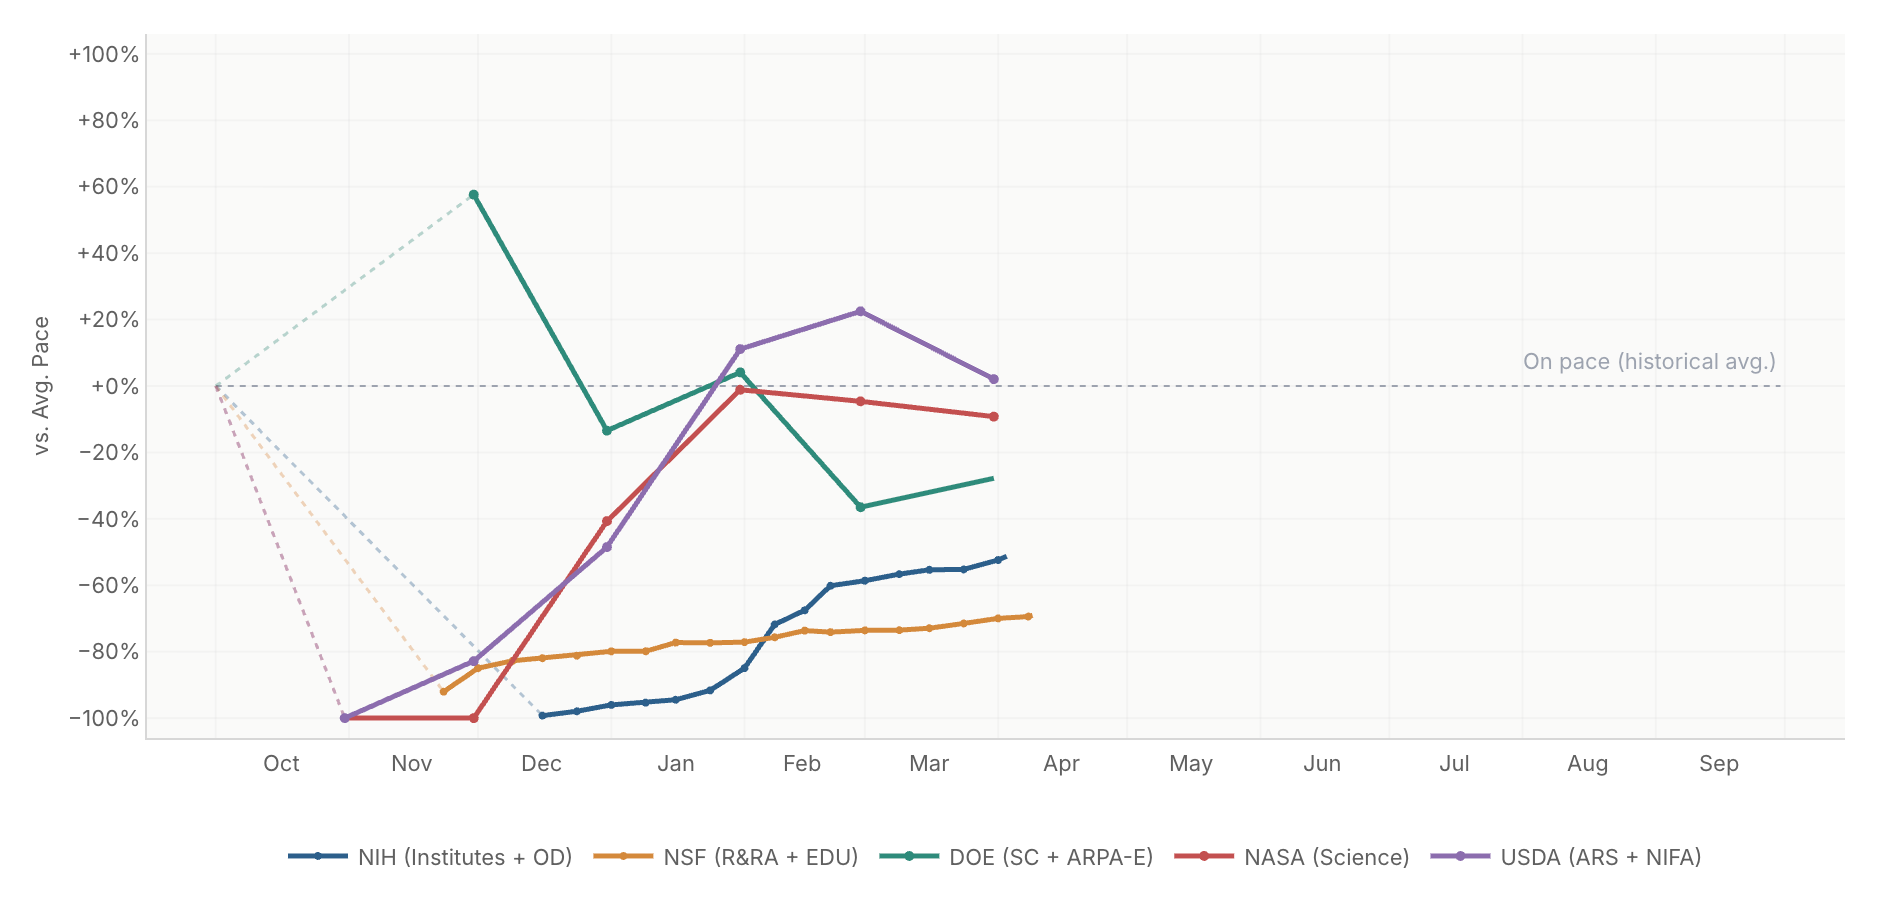
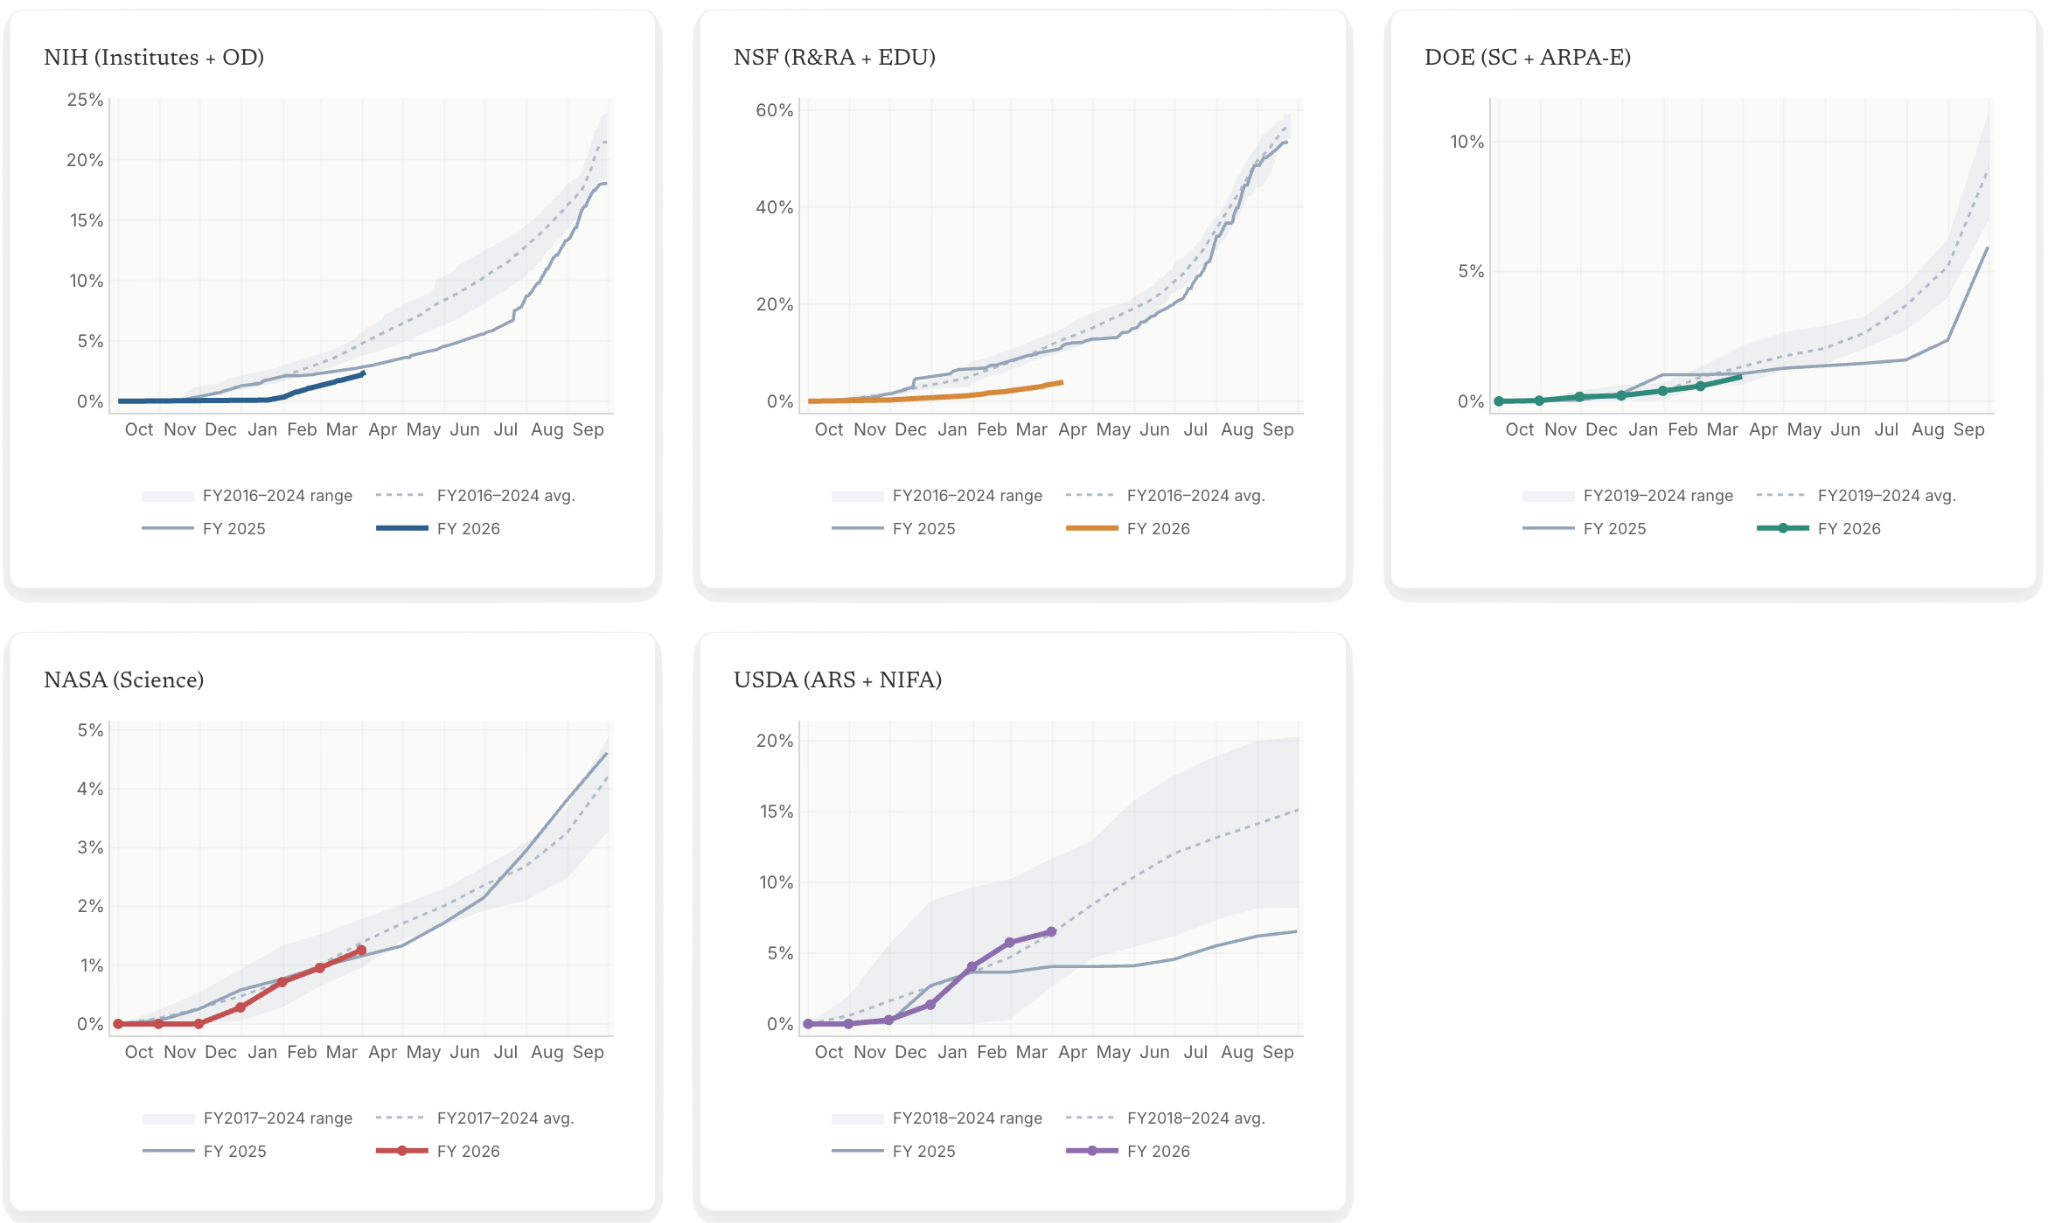
At time of writing, the NSF’s situation is the most concerning. NSF is making new awards roughly 70% slower than typical, and even its more general rates of getting money out of the door (both “all awards” and “obligations”) are almost 60% behind pace.5 In FY25 NIH was able to close a similarly large gap, in part by increasing its use of forward funding;6 NSF has less room to use that lever this year, as it already uses up-front funding for the majority of its grants.
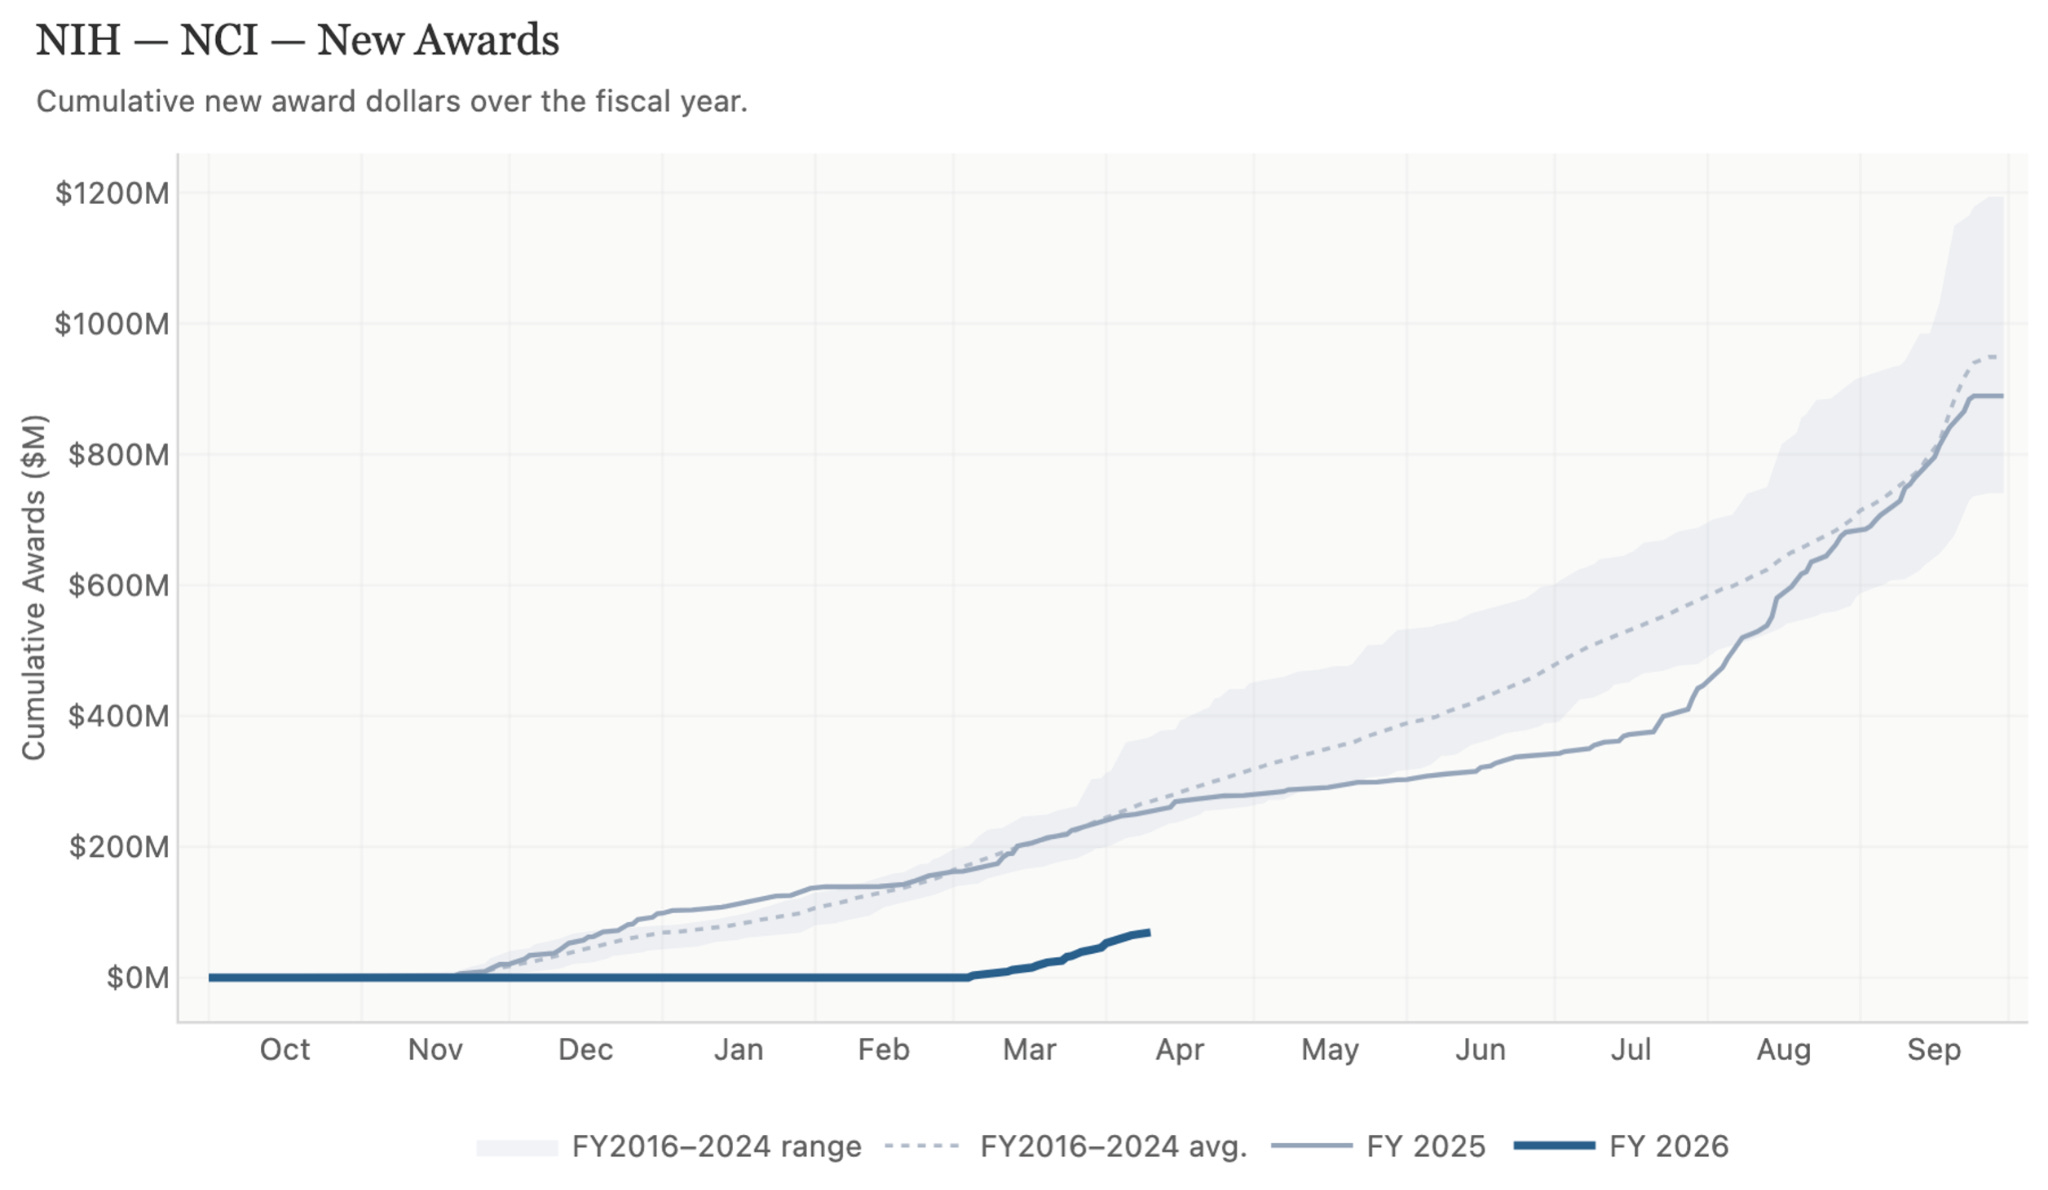
NIH is also significantly behind pace in FY26, spending money on new grants roughly 50% slower than it typically has; it is also 29% behind on all award-making, and 16% behind on all obligations. Notably, these topline numbers hide substantial heterogeneity across institutes. The National Cancer Institute, for example, is even farther behind pace than the agency as a whole, having spent 79% less on new grants, and 43% less on grantmaking overall, than is typical at this point in the fiscal year. The National Institute of General Medical Sciences, meanwhile, is near its normal pace.7
Other agencies are in a better position. DOE’s science spending is a bit behind pace overall, with the Office of Science’s lack of grantmaking8 being balanced out by ARPA-E’s increased spending after having spent well under its appropriation in FY25. NASA is slightly behind its typical pace, and USDA is roughly on track.
There are, of course, legitimate reasons why an agency might be above or below its historical pace in any given month. Government shutdowns delay processing; new policies require revised procedures; large coordinated funding programs can shift the curve. But having insight into patterns within and across agencies can be helpful for spotting troubling or hopeful trends, and understanding when and where attention is needed.
In most years, this kind of tracking would be an esoteric exercise. I hope it will be again soon. Until then, thanks for keeping an eye on it.
To put it mildly.
The CHIPS and Science Act is a good recent example, within which Congress authorized $15.6 billion for NSF in FY24 but ended up appropriating only $9 billion, roughly 40% less than the authorized amount.
What happens to unobligated funds depends on the type of appropriation. NIH operates primarily on single-year appropriations; this means that unspent funds expire at the end of the fiscal year, becoming unavailable for new obligations and eventually returning to the Treasury. This fact makes spending slowdowns at NIH especially concerning. NSF and NASA Science typically receive two-year appropriations, meaning funds not obligated in the first year can be rolled over to the next. Some funding agencies, like DOE’s Office of Science and ARPA-E, primarily receive no-year funds, which are available until expended. Two-year and no-year appropriations give agencies a buffer, but large pots of rolled-over funds can be hard to spend down without additional capacity, and can provide a pretext for rescissions packages.
My approach builds on – and owes much to – the work of others who developed and refined this framework over the past year, including Jeremy Berg, data journalism teams, and Grant Witness.
For these calculations, I use award dollars normalized to relevant appropriations as the primary measure of grantmaking pace. Other efforts focus on award counts or raw award dollars. Both of these metrics are available on the website, but I don’t highlight them because (a) award counts, while meaningful, obscure differences in spending if an agency increases or decreases its use of forward funding, and (b) raw award dollars are affected by appropriations, which can obscure slower spending in years where appropriations are higher.
Forward funding, sometimes called multi-year funding, is when the agency obligates the full multi-year cost of an award up front. Despite being an effective tool for spending funds quickly, in the short run its increased use reduces the number of grants that can be funded in a given year.
NIGMS has spent 9% less on new grants, 22% less on all awards, and 16% less on all obligations than is typical at this point in the fiscal year.
This is a great complement to existing trackers that target other facets of science appropriations.
One note about forward funding: the administration is actually now using this policy punitively against NSF and NIH, by requiring them to forward fund *everything*, not just small grants. This necessarily reduces either the number of grants or the size of grants. A lot of university research groups have been decimated by this change.